Direct BMI Calculation Formulas (Metric & Imperial)
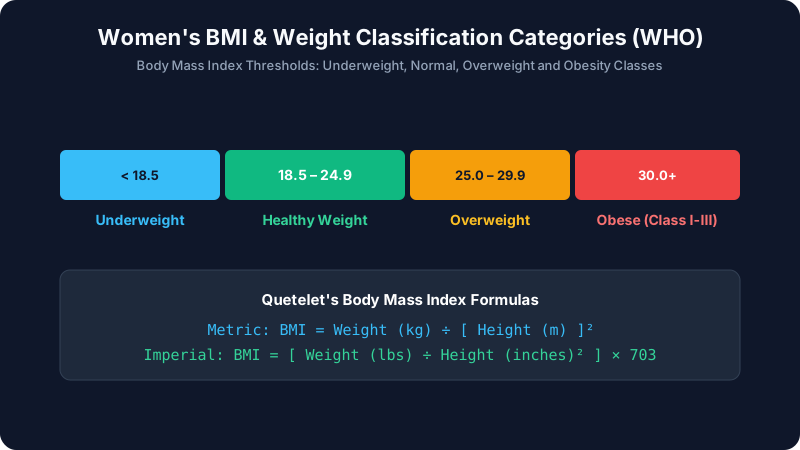
The mathematical formulation for Body Mass Index—originally devised by Belgian statistician Adolphe Quetelet—evaluates weight relative to the square of height:
// Standard International Metric Formula
BMI = Weight (kg) / [ Height (m) ]²
// Imperial Formula (Pounds & Inches)
BMI = [ Weight (lbs) × 703 ] / [ Height (inches) ]²
For example, a woman standing 5 feet 5 inches tall (65 inches / 1.651 meters) weighing 145 pounds (65.77 kg):
- Metric: 65.77 / (1.651 × 1.651) = 65.77 / 2.7258 = 24.13 kg/m² (Normal Weight).
- Imperial: (145 × 703) / (65 × 65) = 101,935 / 4,225 = 24.13 kg/m².
Why Women's Physiology Demands Nuanced BMI Interpretation
While the mathematical BMI formula does not differentiate by sex, female physiology diverges significantly from male body composition:
1. Essential Biological Fat Levels
Essential fat for males is 2% to 5%. For females, essential fat is 10% to 13%. Women require higher adipose mass to sustain ovulation, estrogen production, and uterine lining maintenance. Dropping below 15% to 17% body fat in women frequently triggers secondary amenorrhea (cessation of menstrual cycles) and bone mineral density loss (osteopenia).
2. Gynoid vs. Android Adipose Distribution
Pre-menopausal women typically store adipose tissue subcutaneously around the hips, glutes, and thighs (gynoid 'pear' shape), mediated by estrogen receptors. Subcutaneous gynoid fat is metabolically protective, sequestering fatty acids away from internal organs. Men and post-menopausal women, conversely, tend to store visceral fat around abdominal organs (android 'apple' shape), which directly releases inflammatory cytokines into the hepatic portal vein.
Calculate Female BMI & WHtR with BentoQuilt
Calculate your Body Mass Index, ideal weight ranges, and waist-to-height cardiovascular metrics in metric or imperial units.
Waist-to-Height Ratio (WHtR): The Clinical Gold Standard
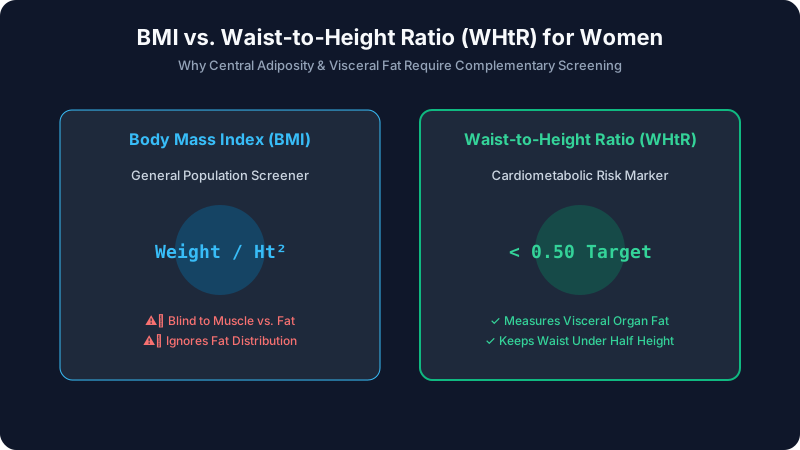
Because BMI cannot differentiate between skeletal muscle mass, bone density, and visceral adipose tissue, medical organizations (such as the UK National Institute for Health and Care Excellence, NICE) recommend pairing BMI with Waist-to-Height Ratio (WHtR):
Waist-to-Height Ratio = Waist Circumference / Height (Same Units)
Clinical Benchmark: Keep your waist circumference to less than half your height (Ratio < 0.50).
A female athletic sprinter with dense gluteal and quadricep muscular development may have a BMI of 26.2 (technically 'Overweight' on basic BMI scales), but a waist-to-height ratio of 0.42, indicating virtually zero cardiometabolic risk.
Worked Clinical Case Studies: Muscle Density vs Post-Menopause
Case Study 1: Resistance-Trained Female Athlete
A 28-year-old female strength athlete stands 5 ft 6 in (1.676 m) and weighs 162 lbs (73.48 kg). Her waist measures 27.5 inches:
BMI = (162 × 703) / (66 × 66) = 113,886 / 4,356 = 26.14 kg/m² (Classified 'Overweight')
Waist-to-Height Ratio = 27.5 in / 66.0 in = 0.417 (Optimal Metabolic Range < 0.50)
DXA Scan Body Fat: 21.4% (Athletic Fitness Range: 21%–24%)
Conclusion: Athlete is metabolically elite. The 'overweight' BMI is an artifact of lean skeletal muscle density.
Case Study 2: Normal Weight Post-Menopausal Sarcopenia
A 58-year-old woman stands 5 ft 3 in (1.60 m) and weighs 130 lbs (59.0 kg). Her BMI is 23.03 (solidly 'Normal'). However, post-menopausal estrogen decline led to muscle loss (sarcopenia) and an accumulation of visceral abdominal fat, yielding a waist circumference of 34 inches (WHtR = 34 / 63 = 0.54). Blood tests reveal elevated fasting blood glucose (108 mg/dL) and elevated triglycerides, demonstrating 'Normal-Weight Obesity' despite a healthy BMI score.
WHO Adult Weight Classification & Clinical Health Matrix
| Classification | BMI Range (kg/m²) | Asian Population Cutoff | Associated Clinical Risk Profile |
|---|---|---|---|
| Severe Thinness | < 16.0 | < 16.0 | High risk of amenorrhea, osteopenia, anemia |
| Underweight | 16.0 – 18.4 | 16.0 – 18.4 | Elevated fracture risk, impaired immune function |
| Normal Healthy Weight | 18.5 – 24.9 | 18.5 – 22.9 | Lowest statistical mortality across adult population |
| Overweight (Pre-Obese) | 25.0 – 29.9 | 23.0 – 27.4 | Moderate risk of hypertension, dyslipidemia |
| Obesity Class I | 30.0 – 34.9 | 27.5 – 32.4 | High risk of Type 2 diabetes, sleep apnea, CVD |
| Obesity Class II & III | ≥ 35.0 | ≥ 32.5 | Severe metabolic and cardiovascular morbidity |
Clinical Limitations: Pregnancy, Breastfeeding, and Aging
Standard BMI calculators are completely invalid during pregnancy and active lactation. Obstetric guidelines (such as ACOG) utilize pre-pregnancy BMI solely to establish recommended gestational weight gain targets (e.g., 25–35 lbs for normal weight, 11–20 lbs for obese pre-pregnancy classifications). Additionally, in women over 65, epidemiologic data demonstrates the 'obesity paradox,' where individuals with slightly elevated BMIs (25.0 to 27.0) experience lower all-cause mortality and improved survival rates during acute hospitalizations compared to elderly women in the lower normal BMI band.